F&B DTC Paid Media · Schaefer

Stop guessing where your next ad dollar goes.

The paid media agency F&B brands hire when they are done guessing where their next ad dollar should go. Customer intelligence, budget allocation, and analytics — engineered to compound.

Tell Us About Your Brand → See how the guarantee works →
6+
Platforms competing for the same budget
~40%
Of paid spend is misallocated — on average
1
Right answer per brand, per quarter
The question every F&B operator asks

"Where do I spend my ad budget — and how do I know it's working?"

Channels multiply. CPMs rise. Attribution breaks. The job isn't to spend more — it's to spend the next dollar in the place where it compounds.

Most agencies don't answer that question. They report last month's results and hand you a dashboard. We build the system that answers it weekly — and gets sharper every cycle.

The three-body problem
Customer Intelligence
Know everything about your best buyers — who they are, what they buy, why they come back.
Budget Allocation
Channel, budget, timing, creative volume, and messaging — engineered to win each platform's algorithm.
Analytics That Answer "Why"
Not dashboards. Decisions. We measure what moved, what didn't, and what to do next.
The Problem · Where Paid Dollars Leak

~40% of paid spend is misallocated. Most of it leaks in four predictable places.

Each leak maps to one of the three pillars. The diagnosis is the design brief. We fix all four — not because the playbook says so, but because leaving any one of them open costs you compounding returns every week it stays open.

~40%
OF EVERY PAID DOLLAR
DOESN'T COMPOUND
INDUSTRY AVERAGE · 2026
60% · ALREADY WORKING
↓ THE 40% · BROKEN DOWN BELOW
WORKING SPEND · COMPOUNDS
LEAK 01
WHO
Poor Audience Targeting
REACHING PEOPLE WHO WILL NEVER CONVERT — OR ALREADY CONVERTED.
FIXED BY
PILLAR 01
CUSTOMER INTELLIGENCE
LEAK 02
WHERE
Suboptimal Placements
SPEND GETS PLACED WHERE IT'S CHEAP — NOT WHERE IT PERFORMS.
FIXED BY
PILLAR 02
BUDGET ALLOCATION
LEAK 03
WHAT
Creative Fatigue
THE SAME CREATIVE RUNS TOO LONG — PERFORMANCE DECAYS FAST.
FIXED BY
PILLAR 02
BUDGET ALLOCATION
LEAK 04
WHY
No Feedback Loop
DECISIONS AREN'T INFORMED BY WHAT WORKED — SO WE KEEP REPEATING MISTAKES.
FIXED BY
PILLAR 03
ANALYTICS
PILLAR KEY (THE FIX)
PILLAR 01 · CUSTOMER INTELLIGENCE
DEFINES WHO TO REACH
PILLAR 02 · BUDGET ALLOCATION
DECIDES WHERE + WHAT TO FUND
PILLAR 03 · ANALYTICS
MEASURES WHAT WORKED + WHY
SOURCES · MOTION CREATIVE BENCHMARKS 2026 · MAKO METRICS · LOGICAL POSITION 2026 PAID SOCIAL PLAYBOOK · RYZE AI · ADAMIGO SCHAEFER — PAID MEDIA, ENGINEERED.
Our Thesis

Winning paid media is a
three-body problem.
We've solved all three.

Everyone sells "media buying." We compete on a tighter stack: the customer, the dollar, and the feedback loop between them. Each pillar reinforces the next. Together they produce results that compound — not results that plateau.

Pillar 01
Customer Intelligence
We know everything about your best customers — who they are, what they buy, why they come back. Not personas. Not demographics. Actual purchase behavior pulled from your data, enriched by ours, and pointed directly at acquisition.
Pillar 02
Budget Allocation
Channel, budget, timing, creative volume, and messaging — engineered to win each platform's algorithm. The right answer changes weekly. We run the operating system that keeps pace.
Pillar 03
Analytics That Answer "Why"
Not dashboards. Decisions. Every number points back to a choice we're about to make. Incrementality testing, cohort LTV, creative diagnostics — all reporting to the next week's plan.
Pillar 01 · Customer Intelligence

Not demographics. Actual purchase behavior, focused into one cohort.

Four data sources in. One high-LTV cohort out. Pointed directly at acquisition.

We isolate the cohort that drives 70–80% of your LTV and build every targeting decision around them — not the average buyer. Then we map what triggers their first purchase: category, occasion, creative cue, price point, shelf adjacency.

Customer Intelligence: four data inputs feeding a 20% best-customer cohort (70-80% LTV) projected to Meta, TikTok, Google, Amazon DSP, and CTV

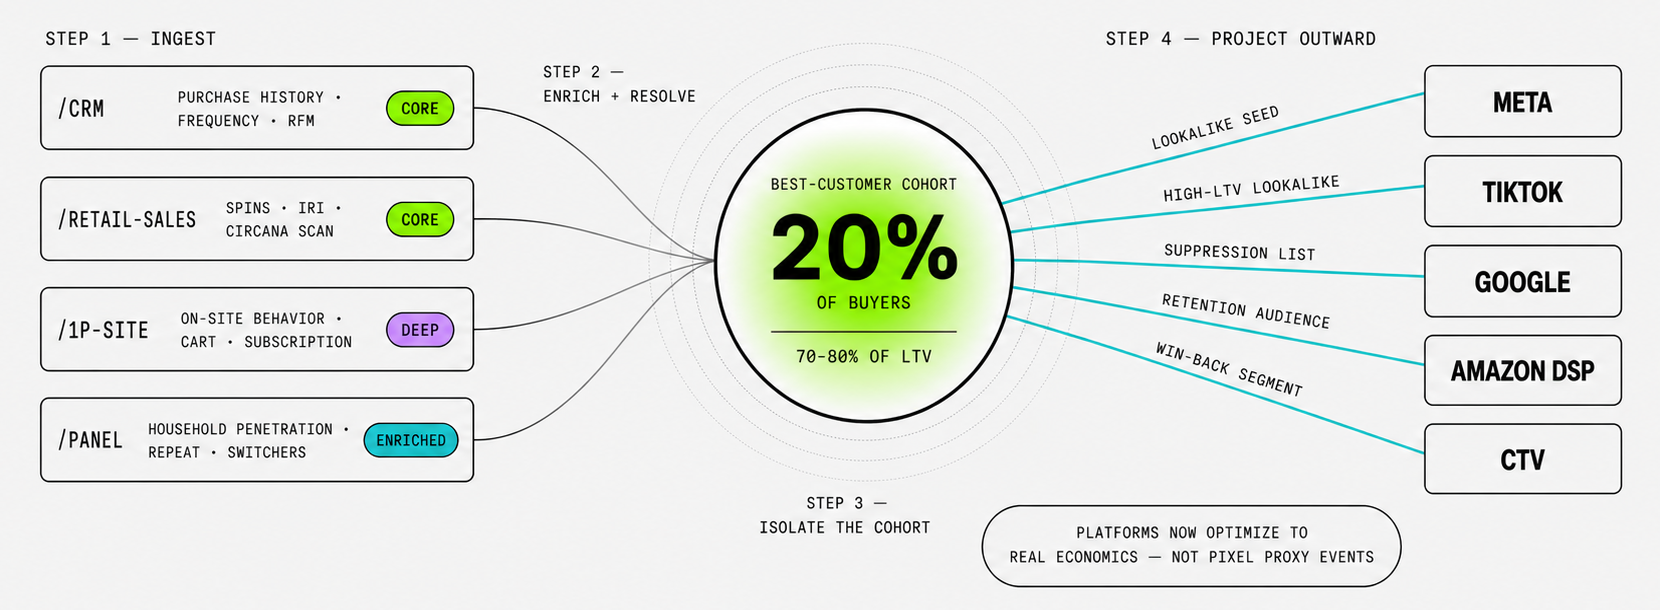
Four data sources we ingest.

/CRM — Core
Purchase history, frequency, and RFM segmentation. The foundation of who's actually buying — and who's buying twice.
/Retail-Sales — Core
SPINS, IRI, and Circana syndicated scan data. Shelf-level truth about category movement and competitive dynamics.
/1P-Site — Deep
On-site behavior, cart data, and subscription signals. The digital layer that shows purchase intent before the transaction.
/Panel — Enriched
Household penetration, repeat rate, and switcher identification. Understanding who your buyer is in the context of their household.

What we build from it.

20%
Best-customer cohort
The top 20% of buyers who drive 70–80% of your LTV. Every targeting decision — bid strategy, lookalike seed, suppression list, win-back segment — is built around this cohort, not the average buyer.
Lookalike seeds built on real economics
Seeds built on high-LTV data — not pixel proxy events — so platforms optimize toward your actual economics, not a conversion signal that's three steps removed from revenue.
Cohort rebuilt quarterly
Buyer behavior shifts. We refresh the best-customer definition every quarter so the algorithm is always chasing the right signal.
Pillar 02 · How Targeting Actually Works Now

You used to pick the audience, then make the ad. Now you make the ads, and the algorithm picks the audience.

Meta's Andromeda update shifted 56% of campaign performance to creative quality. The old playbook — define the audience, make one hero ad, run until fatigue — is no longer the winning move.

Pre-2024 audience-led vs 2026 Andromeda creative-led targeting comparison
Source — Meta · Motion Creative Benchmarks 2026 · 578,750 ads · $1.29B spend analyzed
56% of campaign performance is now driven by creative quality. The variable that still separates winners is the creative itself — not the audience definition.
Pillar 02 · Budget Allocation

Five levers. One algorithm. Retuned weekly.

The right answer changes every week. We run the operating system that keeps pace — selecting channels, sizing budgets, timing flights, and feeding algorithms the volume and variety they need to win. We don't pick a plan and hope. We run it, measure it, and retune it.

Five levers — Channel Selection, Ad Budgeting, Creative Volume, Timing, Messaging — feeding the algorithm
Lever 01
Channel Selection
Which platforms, in what mix, at what stage of growth — decided by incrementality testing, not habit or convention.
Lever 02
Ad Budgeting
Daily, weekly, and flight-level spend pacing that matches demand shape — not calendar convenience or arbitrary monthly caps.
Lever 03
Creative Volume
The platform algorithm rewards variety. We engineer a production pipeline that delivers 20–30 creatives per cycle — at cost, inside the retainer.
Lever 04
Timing
Launches, refreshes, and dayparts timed to the moments the algorithm is hungriest for your category. Not the media calendar.
Lever 05
Messaging
Hooks written for the platform — not the brand deck. We feed what the model rewards, in your voice, at the volume it needs to test.
Outcome
We win the algorithm.
Compounding delivery, falling CPMs, rising conversion — because the platform sees us as a preferred advertiser. That status compounds every week we hold it.
Pillar 02 · Creative Fatigue in the Andromeda Era

The same dollar of creative now has half the runway.

Ad lifespans have compressed ~50% since 2023. Pre-Andromeda, a winning creative ran 6–8 weeks. Post-Andromeda, it runs 2–4 weeks before decay. That means the brands still producing one hero asset and running it until fatigue are now burning half their creative value in dead air.

Pre vs post-Andromeda creative lifespan: 6-8 weeks compressed to 2-4 weeks
Pillar 03 · Analytics

Analytics that tell you what worked — and why.

Most agency reports are mirrors. Ours are instruments. Every number points back to a decision we're about to make. Not what happened last month — what we're doing Monday morning.

Capability What it answers Decision it drives Cadence
Incrementality testing Did this channel actually cause the sale? Kill, scale, or re-weight a channel Monthly
MMM light How do channels interact over time? Reallocate budget across the full mix Quarterly
Creative diagnostics Which hook, format, or angle moved the needle? Next brief to the creative team Weekly
Cohort LTV Are we acquiring the right customer? Target, bid, and creative adjustments Rolling
Retail lift (F&B) Did digital move the shelf? Trade-spend and media-spend alignment Quarterly
The Operating Loop · How the System Runs

One pillar is a tactic. Three is a system.

Each pillar sharpens the next. Customer intelligence points the budget. Budget execution generates the signal. Analytics retunes both — every week. The loop runs indefinitely. The moat gets deeper every cycle.

The Schaefer operating loop: Customer Intelligence → Budget Allocation → Analytics → compounding results
Step 01
Identify the best-customer cohort and their buying triggers
Step 02
Allocate channel mix, budget, timing, creative, and messaging toward that cohort
Step 03
Measure what's working, what isn't, and why — at the decision level
Step 04
Retune customer definition and allocation on next week's plan
Step 05
Compound. Each loop is smarter than the last — and the moat gets deeper.
Why Schaefer

Why we don't sound like the other agencies in your inbox.

Most agencies sell hours, seats, and dashboards. We sell the decision we'll make with your money on Monday morning.

What we compete on Schaefer Typical paid media agency
Audience targeting Best-customer cohort drives every target Platform-default targeting, generic lookalikes
Budget pacing Built on incrementality testing, reoptimized weekly Budget set once a quarter, adjusted when CPA spikes
Creative output High-volume pipeline engineered to feed the algorithm One hero asset, run until fatigue
Analytics Tied to the next decision, not the last quarter Monthly dashboards, no decisions attached
Category expertise F&B exclusively — retail scan, panel, and shelf fluent Channel-shaped, not category-shaped
Case Study · Organic Dairy · Retail-led

Straus Family Creamery: 118% more monthly conversions in six months.

Organic whole-milk Greek yogurt, sold through grocery and natural retail. We rebuilt the acquisition cohort around repeat-buyer LTV, shifted spend into high-intent moments, and engineered the creative volume the platform needed to keep scaling delivery.

The curve bent — and then kept bending. That's what a system does versus a campaign: it doesn't peak and plateau, it compounds.

Read the case study →
+118%
Monthly conversions · 6-month window
What we did
Rebuilt acquisition cohort around repeat-buyer LTV
Shifted spend into high-intent purchase moments
Engineered creative volume to feed platform algorithm
Creative Work

Creative built from what buyers actually said.

Every brief starts with buyer research. The hook often comes from an interview transcript — verbatim or close to it. That's what makes it land. See how we build ad creative →

Schaefer ad creative examples
The Engagement

One retainer. The whole stack. A guarantee behind it.

We work on monthly retainers, not hourly. Research, analytics, budgeting, and high-volume creative output are all inside the fee — no line-item surprises, no creative re-scopes, no "strategy deck extra."

The Guarantee
If we don't hit the growth targets we set together, the work is free. Metric agreed upfront. 3 months from campaign launch. 100% of fees returned.
In-scope 01
Research
Best-customer work, competitive scans, category positioning — refreshed quarterly. The foundation every campaign is built on.
In-scope 02
Analytics
Incrementality testing, cohort LTV, MMM light, creative diagnostics — reported weekly. Every number points to the next decision.
In-scope 03
Budgeting
Channel mix, pacing, flight timing, bid strategy — re-optimized every week. The right answer on Monday morning, every Monday.
In-scope 04
Creative, at volume
High-volume static and motion output engineered to feed the algorithm — included. No production re-scopes, no extra line items.
In-scope 05
Communication
Attentive, same-day response. A real human on your account — not a pod ticket queue or a junior associate who escalates everything.
In-scope 06
Reporting
Weekly written recap: the decision we made, the result, and what's next. Not a dashboard. A decision log.
Who It's For

Built for F&B brands ready to scale paid — without lighting cash on fire.

We're at our best when the brand has product-market fit, first-party data, and the ambition to make paid a real growth engine — not a line item.

01
Scaling F&B brands
$2M–$100M in revenue, selling through retail and/or direct, with real customer data and the appetite to use it. The brand is working — paid is where the next phase of growth comes from.
02
Operators who want decisions
Teams tired of agency decks that explain last month. They want the call on next week — and they want to understand the reasoning behind it, not just the result.
03
Brands under CPM pressure
Rising acquisition cost, flattening ROAS, and a feeling that the old playbook has stopped working. The leak is usually structural — audience, creative, or analytics. We find it and fix it.
The Schaefer Bet
"Know the customer better. Place the dollar smarter. Measure the answer honestly. Do it every week, for as long as it takes to compound."

If we don't hit the target we set together, you pay nothing. Retainers start at $8,000/month. Every engagement starts with buyer research.

Tell Us About Your Brand →
How the research works → Read the guarantee → See client results →